
Features Ajuste Lineal
This application performs a linear fit of the data provided in X Y.
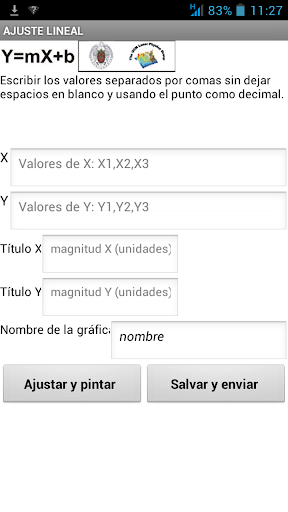
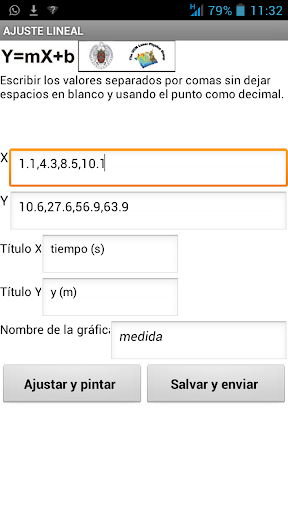
First format data X are introduced into a cell and Y in another cell.
The numbers should be written separated by commas and no space blanco.El is the decimal point symbol.
Pressing the "Fit and paint" button linear fit is performed.
The application calculates the line Y = m * X + b best fit (least squares) to the data and displays the value of the slope "m" and the intercept "b".
Errors of such magnitude and the correlation coefficient indicates the goodness of fit is also shown.
Using the "Google Image Charts" the graph of the data and the fitted line is drawn.
You can add titles to the axes and a name for the graph to be saved later.
Pressing the button "Save and send" graphic included with the previous name is sent using the available device resources.
A copy of the graphic is also stored in the device.
Gaming Features
Enjoy immersive gaming experience with various game modes.
Shopping Features
Shop online and find the best deals.
Smart Home
Control and monitor your home with smart features.
See the Ajuste Lineal in Action

Get the App Today
Available for Android 8.0 and above